Benford's Law: A Real Life Case Study

Pete Miller Color Publicity.jpg

By Pete Miller, CFE, CPA
Shareholder, Clark Nuber

Benford’s Law is an example of data analysis, sometimes referred to as data mining or data monitoring. Accounting systems are churning out gobs of data these days, and without consistent and organized data analysis, it is just too easy to hide even unsophisticated schemes. The mice are indeed getting smarter, so the mousetraps you used in the past won’t cut it in today’s environment. Data analysis, dashboards, and other tools are a great way to advance your internal control systems and stay ahead of the fraudsters.

I recently wrote a piece on my company’s blog that gave the basics on Benford’s Law. Most of you likely are familiar with Benford’s Law in your fraud examinations.  I am a big believer in practical application as a tool in learning any new concept, so with that in mind, I wanted to provide an example of how to apply this law based on one of my old case files.  

The main facts you need to know for this example are: 

  • the business had two subsidiaries, so you will see two sets of Benford charts; 
  • funds seemed to be leaking out of these subsidiaries; and 
  • the check-writing or cash disbursement cycle seemed to be the source of that leak.  

Check registers are key sets of data to which a Benford’s Law analysis can be applied. For each of the two subsidiaries, we obtained check registers from the accounting system that spanned approximately 10 years, resulting in approximately 16,000 checks for each subsidiary (32,000 in total) –  definitely a large enough sample for the Benford distribution to be distinct and clear.  

After running this analysis, what I found was very interesting. It is represented in the two charts below.  

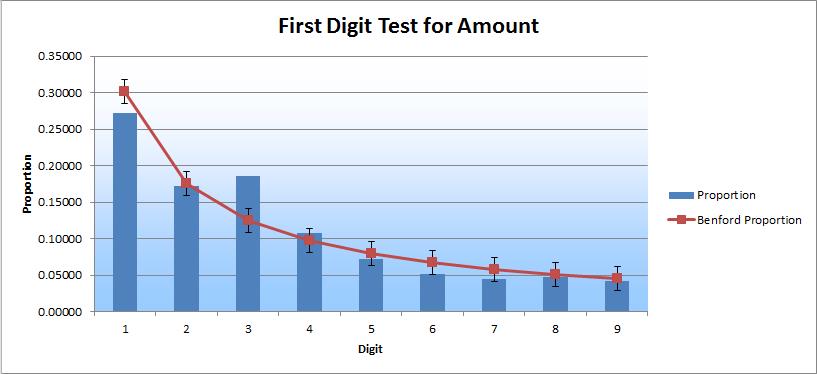
As you can see, the 3-digit column sticks out and is high relative to the Benford curve for both charts. The 2-digit column sticks out as well and is relatively high, but only in the second chart. These results prompted me to drill down into each of the three columns. 

I began to analyze the subsets of data and found that certain vendors had an unusual volume of checks written to them; several vendors had 200 or more checks written to them over this period of time. The other thing I quickly noticed was that many of the vendors with these high volumes had “do not use” included in the vendor name field. That seemed very unusual. I typically expect that this kind of label would be a signal to not use that vendor and that it would also hopefully lead to the eventual removal of that vendor from the master list.  

With these two questions in front of me, I continued digging. Next, I looked at the greater population of checks to see how much total volume was written to these “do not use” vendors over the years. What I found was absolutely staggering.  

A single vendor, in a population of more than 16,000 checks spanning a period of 10 years, had over 1,400 checks written to them over a period of just three years. Nearly 10 percent of the total checks were written to this single vendor, in just one-third of the time. The other entity had more than 1,700 checks written to one vendor over a period of five years. How is that possible? That doesn’t just happen naturally in most businesses. There must be some other reason.

Unfortunately, I am not in a position to share the end results. But, I can say that it led to further investigation, which is the point of Benford’s Law. In and of itself, a Benford’s Law analysis will not produce a smoking gun, but it will shine a light on the cloud of smoke, and if you follow that cloud of smoke, you might find the smoking gun. This is a fine example of the process in action.

Mitigating Fraud Risk in 2016

GUEST BLOGGER

Jeremy Clopton, CFE, CPA, ACDA
Director, Forensics and Valuation Services
BKD, LLP

The end of 2015 is quickly approaching and organizations are planning their activities for 2016, so it seems like a good time to consider the importance of fraud prevention efforts. The numbers are stacked against recovery — 58 percent of the victim organizations in the ACFE’s 2014 Report to the Nations recovered none of their losses — so thinking through how best to mitigate fraud risk is an important exercise. It’s my hope that you gave this consideration throughout the year. In the event you didn’t, there is no better time than the present to start.

One of the most common questions I hear from organizations is, “what can I do to prevent fraud in my organization?”  While I wish I had a great answer to that question, completely preventing fraud is nearly impossible and there is no guarantee that fraud will not occur. However, it is possible to mitigate and manage fraud risks with internal controls (FYI – trust is not one of them).

Based on the information in the Report to the Nations, proactive data monitoring/analysis was the most effective anti-fraud control. When looking at cases where this control was present compared to those where it was not, the report shows a 59.7 percent reduction in median loss and a 50 percent reduction in median duration. While this control is the most effective, it was far from the most common control. In fact, it was present in just over a third of all cases submitted.

Another of the most effective anti-fraud controls was surprise audits, which showed a 43.3 percent reduction in median loss and a 50 percent reduction in median duration. Again, this control was only present in about a third of all cases studied.

Hotlines are also near the top of the list of effective anti-fraud controls. Hotlines resulted in a reduction in median loss of 40.5 percent and median duration of 50 percent. Further, hotlines are responsible for tip-reporting, which is the most common method of detection, according to the report.

As 2016 approaches, many companies will likely wait until a fraud occurs to begin thinking through preventive procedures. I’ve highlighted three of the most effective anti-fraud controls in this post, and there are many others to consider. I hope you will take some time prior to the end of the year to consider what controls you have in place, and what controls you should consider adding, to help mitigate fraud in your organization. Here’s to a happy 2016!

How Uber Can Help Prevent Travel Fraud

GUEST BLOGGER

Jeremy Clopton, CFE, CPA, ACDA
Senior Managing Consultant, Forensic and Valuation Services
BKD, LLP

Uber, the popular travel service, is making headlines for a number of things these days — cities that won’t embrace their services, contract worker and employee disputes, challenges getting service to airports, etc. In my opinion, they should be making headlines in the world of fraud prevention as well. 

Anyone who has traveled by taxi knows how the "receipt" system works. You ask for one and are handed a stack of blank receipts to fill out however you choose. Company policy requires a receipt, so your diligent employee completes one of the blank receipts and turns it in. This likely isn’t exactly the supporting documentation that was imagined when the policy was first created.  

This is where Uber comes in. I used the service for the first time this past month and was impressed with the amount of detail my receipt contained. It included:

  • Time of pickup
  • Miles traveled
  • Route traveled
  • Driver information

I happened to be speaking at a conference on the topic of fraud prevention and quickly realized the value of this receipt. This is the documentation a company policy is trying to obtain. Rather than determining if the taxi fare was really $80, and if that was for the ride to the hotel or to an offsite casino, there would be few questions. I would be able to review:

  • Fare amount
  • Date of travel
  • Starting and ending locations compared to expected travel plans

In addition to providing better documentation to combat fraud, waste and abuse in travel expenses, this example also demonstrates the power of data. All of the documentation is made possible by the data captured in the Uber app, from a variety of data sources. Pulling all of the data together in a single location provides very useful information in the form of an Uber receipt.

It’s easy to see the value of the data Uber is capturing behind the scenes. Hopefully, at some point in the future, that data can be available to corporate users of the service to help automate some of the testing around these expenses. This data, combined with data regarding hotel and airport locations, would allow organizations to electronically cross-reference known travel plans to actual trips taken with Uber. Organizations would be able to quickly identify exceptions to travel plans and investigate reasons for the deviation. With traditional taxi receipts, the closest you can get is using a fare estimator online and checking for reasonableness — all a manual process. Applying analytics to travel data would not only increase effectiveness, but also efficiency.

Think Outside the Financial Data: Visualize Employee Activities

GUEST BLOGGER

Jeremy Clopton, CFE, CPA, ACDA
Senior Managing Consultant, Forensic and Valuation Services
BKD, LLP

We have more data available to us as fraud examiners today than we ever have before. However, we have less data today than we will likely have in the future. These new data sets are new opportunities for us, but also present new challenges. What data sets do you have that you need to leverage for your next fraud examination?

I am a big fan of podcasts, especially those that really grab my attention. Two recent podcast episodes, When Your Conspiracy Theory is True from Note to Self and Eye in the Sky from Radiolab, focused on the use of surveillance in crime prevention and detection. While fascinating, these podcasts didn’t directly relate to the world of fraud prevention and detection. But I found that the same principles can still be applied because of the focus on the use of non-traditional data sets — in this case, location-based — and visualizing them in an fraud examination.

Application in Examinations
Much of the data fraud examiners focus on is in the traditional accounting system, and the data that doesn’t come from the accounting system is still likely financial in nature. As I have mentioned in previous posts, to effectively leverage an organization’s data we need to think outside the financial data. Beyond the financial information, we have great amounts of data at our disposal about our companies and related activities. Take, for instance, data regarding access: access to buildings, computers, networks, phones, access to anything that tracks the user. This information can be used to essentially track an employee throughout your organization during the day, using such details as:

  • Time of first email access
  • Time when the person entered the parking garage
  • Time accessing the building
  • Time logging on to the computer
  • File access times
  • Breaks during the day based on computer activity
  • Print times for individual documents
  • Time logging off the computer
  • Time leaving the building
  • Time leaving the parking garage
  • Re-entry of any location
  • IP address if logged in off-site

While you may not have video or pictures tracking your employees, like the technology referenced in these podcasts, you do have individual data points that allow you to track your employees’ activities during the day so you can begin to create a picture of what their activities look like. Visualizing this information may be a benefit to you in your next fraud examination. If nothing else, it may help you narrow down the list of those you want to investigate further.

Casting a Net(work) to Crack Down on Corruption

GUEST BLOGGER

Jeremy Clopton, CFE, CPA, ACDA
Senior Managing Consultant, Forensics and Valuation Services, BKD, LLP

In nearly every industry in the 2014 Report to the Nations, corruption was the most common fraud scheme. And while this means there is likely plenty of attention given to corruption, it remains one of the more difficult types of fraud to detect and try to prevent. Much of the basis of corruption is power and influence, neither of which typically show up in the financial aspects of an organization. However, we do have something in our organizations we can use to take a more aggressive approach to detecting corruption — data.

Data Types
We have more data in our organizations now than we have ever had. Organizations continue to generate more data each day — data with great variety. It is the variety of data that provides us a means by which to take a more aggressive approach to addressing corruption. We need to analyze all of the data we have in our organizations, both structured and unstructured. Structured data comes in columns and rows, neatly organized. This is the data traditionally analyzed in examinations. Unstructured data is everything else, which in many organizations accounts for 80 percent of the data. This has typically been left to the digital forensics specialists for analysis.

Analysis Methods
When it comes to analyzing data sets to address corruption, it takes more than just structured data. That said, the structured data is a great place to start. An analysis of attributes of vendors, customers, employees and others an organization is doing business with can provide insights into potential relationships and conflicts of interest. The results of the attribute analysis becomes the foundation for further analysis that includes unstructured data. 

Incorporating all of the available unstructured data is a critical next step when addressing corruption in an organization. One of the key data sets for expanding the relationship network related to individuals in your organization is communications data. Email, phone logs, text messages and other means of electronic communication provide context around the relationships between individuals inside and outside the organization. Not only the entities and individuals in the email, but the actual content of the messages and nature (tone) of the communications.

In addition to communications data, other useful information includes social media postings, business documents and information regarding an individual’s role in a particular business process (such as purchasing/contracts). Using this information, coupled with the communications data and relationships from attributes, allows you to build an enhanced relationship network that provides insights not otherwise available in the normal course of business. This network may provide the information you need to identify signs of corruption in your organization.

Additional Information
To learn more about this topic, head over to Fraud-Magazine.com and check out the Fraud EDge column. A colleague and I recently wrote a six-article series on the topic of integrating data analytics and digital forensics for more effective analysis of all data in an organization. If you’re attending the upcoming ACFE Global Fraud Conference, I will be presenting on this very topic. I hope to see you there!